7 Financial KPIs Every Small Business Owner Should Track to Improve Profitability
Growing a business involves more than increasing revenue. Higher sales can indicate progress, but they don't always mean a company is becoming more profitable or financially stable.
A business might generate more revenue than ever while profit margins shrink, expenses rise, or cash flow remains strained. Without monitoring the right financial information, these problems can go unnoticed until they begin affecting daily operations.
That's why understanding financial KPIs for small business is essential.
Key performance indicators (KPIs) help business owners measure financial performance, identify developing trends, and make decisions based on actual results rather than assumptions.
With the right financial metrics and guidance, businesses can move beyond reviewing what happened last month and begin planning more effectively for the future.
What Are Financial KPIs?
Financial KPIs are measurable indicators used to evaluate a company's financial health and performance.
Unlike general financial reports, KPIs focus on specific areas that influence profitability, liquidity, operational efficiency, and growth.
For example, a profit and loss statement shows revenue and expenses over a particular period. Financial KPIs take that information further by helping business owners understand how efficiently revenue becomes profit and whether performance is improving.
If you're unfamiliar with the information contained in your financial statements, our guide on how to read a profit and loss statement explains the fundamentals.
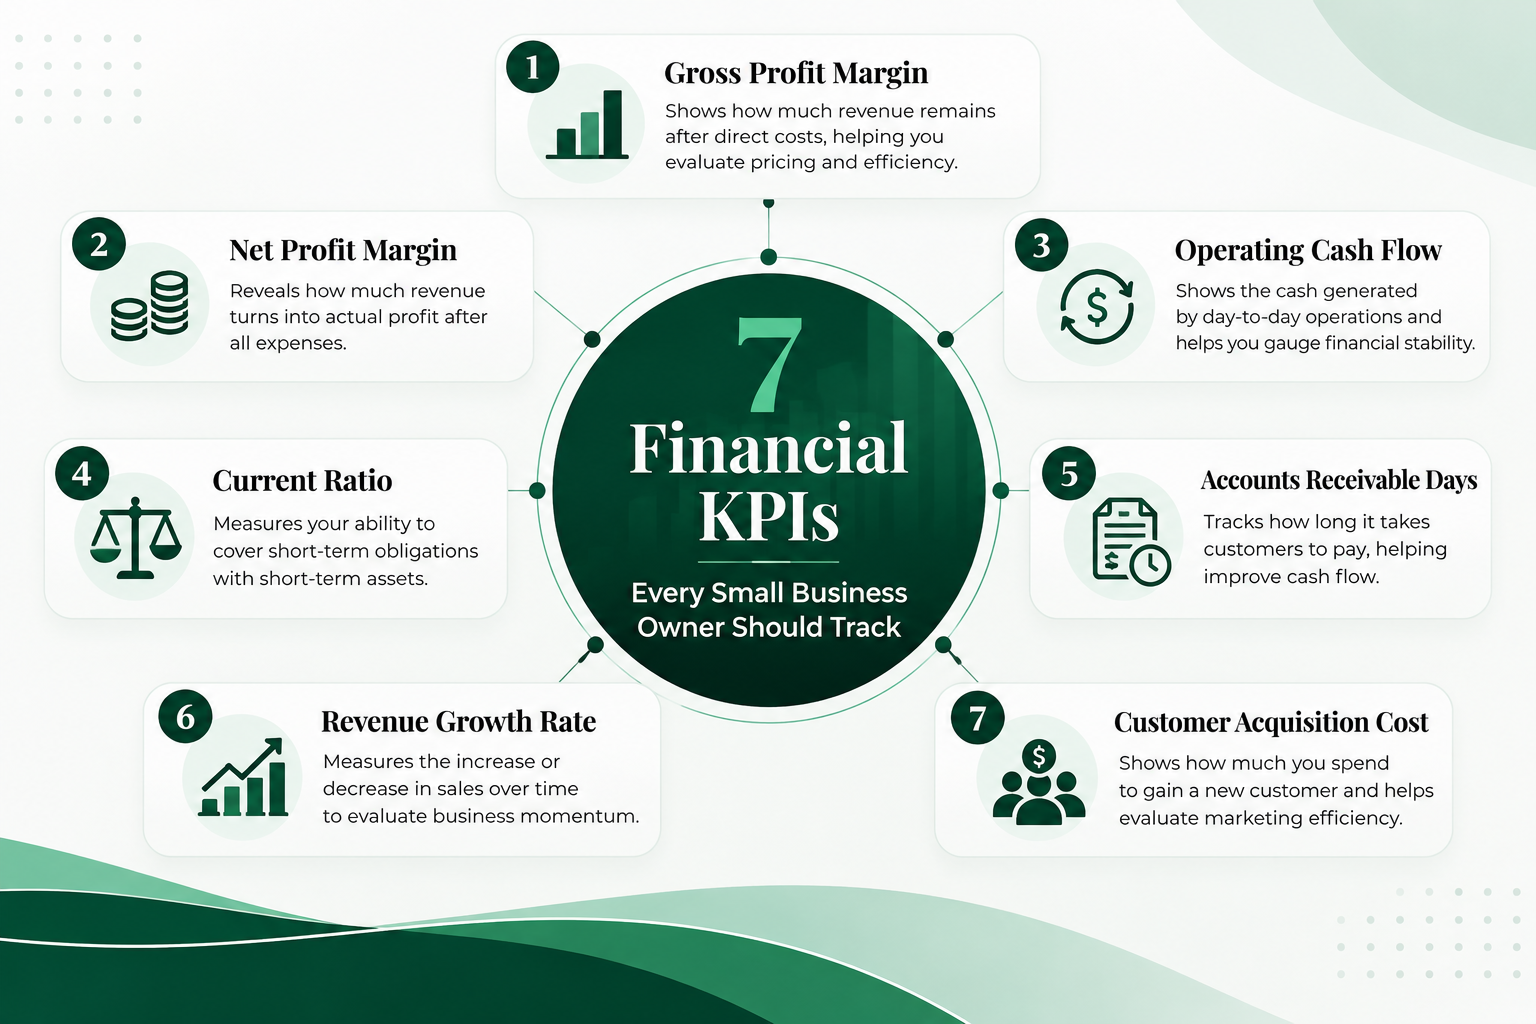
Once you understand your financial reports, tracking the following seven KPIs can provide additional insight into your business.
1. Gross Profit Margin
Gross profit margin measures how much revenue remains after subtracting the direct costs associated with producing goods or delivering services.
Formula: Gross Profit Margin = (Revenue − Cost of Goods Sold) ÷ Revenue × 100
Suppose your business generates $100,000 in revenue and spends $60,000 on direct costs. Your gross profit margin would be 40%.
This means 40 cents of every revenue dollar remains to cover operating expenses and contribute toward profit.
Monitoring gross profit margin can help identify:
Increasing production or service delivery costs
Pricing that no longer reflects operating conditions
Products or services with declining profitability
Opportunities to improve operational efficiency
If revenue increases while gross profit margin declines, your business may be working harder without receiving the same financial return.
2. Net Profit Margin
Net profit margin measures the percentage of revenue remaining after accounting for all expenses, including operating costs, interest, and taxes.
Formula: Net Profit Margin = Net Profit ÷ Revenue × 100
For example, if your company generates $200,000 in revenue and earns $30,000 in net profit, your net profit margin is 15%.
Tracking this metric helps determine whether revenue growth is translating into improved profitability.
A declining net profit margin may indicate rising overhead, inefficient spending, or pricing challenges.
Rather than focusing exclusively on increasing sales, business owners should regularly evaluate whether their operations are becoming more profitable.
3. Operating Cash Flow
Profitability and cash flow are closely connected, but they are not the same thing.
A business can report a profit while struggling to pay expenses because customers haven't paid outstanding invoices or too much cash is tied up in inventory.
Operating cash flow measures the cash generated or used by regular business activities.
Monitoring this KPI helps business owners understand whether daily operations are generating enough cash to support ongoing financial obligations.
Consistently negative operating cash flow may signal problems with collections, spending, or the timing of incoming and outgoing payments.
Cash flow visibility also supports better decisions about hiring, equipment purchases, and expansion.
Our article on financial forecasting for small businesses explains how projecting future cash needs can improve financial planning.
4. Current Ratio
The current ratio measures a business's ability to cover short-term financial obligations using its short-term assets.
Formula: Current Ratio = Current Assets ÷ Current Liabilities
Current assets generally include cash, accounts receivable, inventory, and other assets expected to convert into cash within one year.
Current liabilities include obligations typically due within the same period.
For example, a business with $150,000 in current assets and $100,000 in current liabilities has a current ratio of 1.5.
A ratio above 1 generally indicates that current assets exceed current liabilities. However, the appropriate ratio varies by industry and business model.
A strong current ratio doesn't automatically guarantee healthy cash flow, particularly when assets include slow-moving inventory or overdue receivables.
Reviewing this metric alongside operating cash flow provides a more complete picture of short-term financial stability.
5. Accounts Receivable Days
Generating sales is important, but collecting payment is equally critical.
Accounts receivable days, commonly called Days Sales Outstanding (DSO), measures approximately how long customers take to pay invoices.
Formula: DSO = Average Accounts Receivable ÷ Credit Sales × Number of Days
For example, if a business has average accounts receivable of $50,000 and generates $150,000 in credit sales during a 90-day period, its DSO is 30 days.
An increasing DSO may indicate that customers are taking longer to pay.
This can create cash flow pressure even when revenue remains strong.
Monitoring collections trends helps businesses identify payment delays, review credit terms, and improve invoicing procedures.
Reducing unnecessary collection delays can improve financial flexibility without requiring additional sales.
6. Revenue Growth Rate
Revenue growth rate measures how much sales have increased or decreased between comparable periods.
Formula: Revenue Growth Rate = (Current Revenue − Previous Revenue) ÷ Previous Revenue × 100
If your business generated $250,000 last quarter compared with $200,000 during the same quarter last year, revenue growth would be 25%.
While this indicates increased sales activity, revenue growth should never be evaluated independently.
Business owners should compare growth against operating expenses, profit margins, and cash flow.
Rapid growth can introduce financial challenges when additional employees, inventory, equipment, or overhead are required to support expanding operations.
Before committing to major investments, consider reviewing our guide on how to know if your business can afford to hire, expand, or invest in growth.
7. Customer Acquisition Cost
Customer acquisition cost (CAC) measures how much a business spends to acquire a new customer.
Formula: CAC = Sales and Marketing Acquisition Costs ÷ New Customers Acquired
For example, if a company spends $12,000 on sales and marketing activities and acquires 20 new customers, its customer acquisition cost is $600.
This metric helps businesses evaluate the financial efficiency of their marketing and sales investments.
However, acquisition cost should be considered alongside customer profitability, retention, and expected customer lifetime value.
Spending $600 to acquire a customer may be reasonable for a business generating substantial recurring revenue, but unsustainable for one earning considerably less per customer.
Understanding these relationships helps leadership make more informed decisions about marketing budgets and growth strategies.
How Often Should Small Businesses Review Financial KPIs?
Tracking financial KPIs is most useful when it becomes part of an ongoing management process.
Monthly reviews can help identify changes in profitability, expenses, collections, and cash flow before they become larger problems.
Quarterly reviews provide an opportunity to evaluate broader trends and determine whether financial performance aligns with business objectives.
Rather than reviewing individual numbers in isolation, compare results against previous periods, established targets, and financial forecasts.
The goal isn't simply to collect more financial information. It's to identify what the numbers reveal and determine which actions could improve performance.
How a Fractional CFO Helps Turn Financial KPIs Into Better Decisions
Understanding financial KPIs is one step. Knowing how to use them to guide business strategy is another.
A Fractional CFO helps business owners connect financial performance with operational decisions, future investments, and long-term goals.
Through Fractional CFO and Financial Planning services, K.G. Tax & Accounting Solutions provides financial reporting, KPI dashboards, cash flow management, budgeting, forecasting, and profitability guidance.
This support helps business owners identify which metrics matter most, understand developing financial trends, and evaluate potential improvements.
For example, declining margins might indicate a need to adjust pricing. Increasing collection periods could require changes to payment processes. Strong revenue growth combined with limited cash reserves may suggest that expansion should be approached carefully.
A Fractional CFO helps translate these findings into practical financial strategies.
Make More Informed Financial Decisions With K.G. Tax & Accounting Solutions
Financial KPIs provide valuable insight into how your business is performing, but their greatest value comes from using that information to make better decisions.
Regularly monitoring profitability, cash flow, liquidity, revenue growth, and customer acquisition costs can help you identify opportunities and prepare for potential challenges.
K.G. Tax & Accounting Solutions helps business owners move beyond basic financial reporting with strategic Fractional CFO guidance designed to support profitability, financial planning, and sustainable growth.
Ready to make your financial numbers work harder for your business? Explore our Fractional CFO and Financial Planning services to learn how strategic financial leadership can help you plan your next move with greater confidence.


