
Insights & how-tos for smarter financial decisions
Short posts and guides written for busy owners — fast reads with real actions. Topics include tax tips, bookkeeping best practices, growth planning, and product updates.
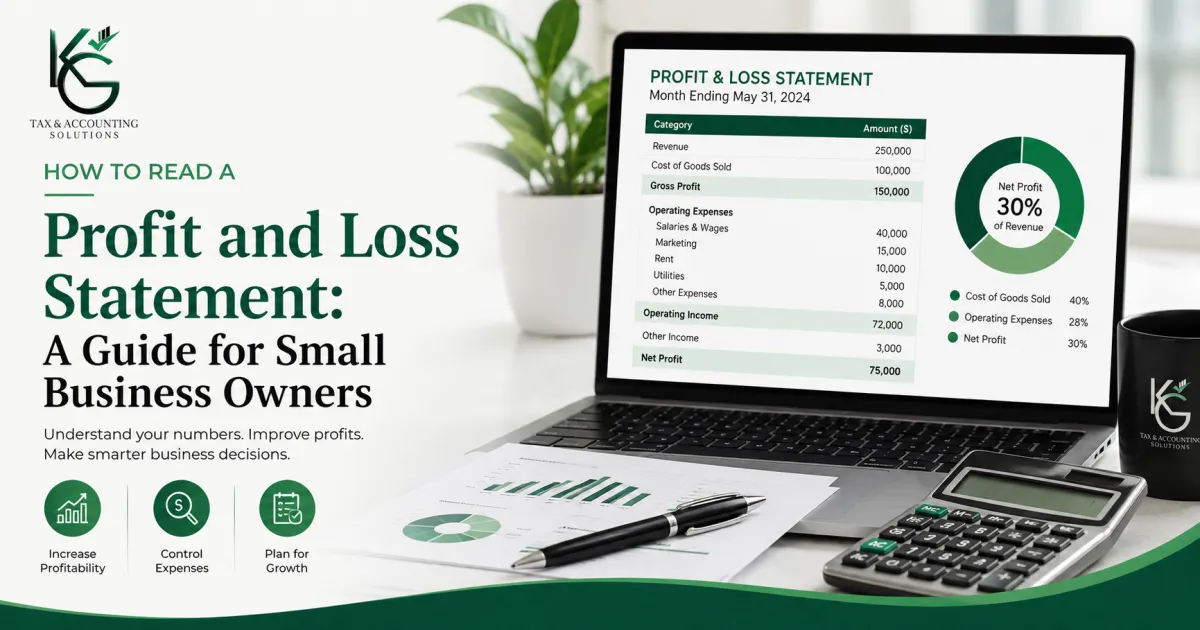
How to Read a Profit and Loss Statement: A Guide for Small Business Owners
How to Read a Profit and Loss Statement: A Guide for Small Business Owners
Running a business means making decisions every day. Should you hire another employee? Can you afford to increase your marketing budget? Are your prices high enough? Is the business actually becoming more profitable as revenue grows?
Your profit and loss statement (P&L), commonly called a P&L statement, can help answer many of these questions.
A P&L provides a snapshot of your company's financial performance over a specific period. However, simply receiving the report each month is not enough. Business owners need to understand what the numbers are telling them and how those numbers can guide future decisions.
Learning how to read a profit and loss statement can help you identify trends, control expenses, understand profitability, and make more informed decisions about where your business is headed.
What Is a Profit and Loss Statement?
A profit and loss statement summarizes the revenue your business earned and the expenses it incurred during a particular period, such as a month, quarter, or year.
It ultimately answers a fundamental question:
Did the business make or lose money during this period?
Your P&L is also commonly referred to as an income statement. While formats vary depending on the business and accounting system, most reports include several core categories.
These typically include:
Revenue
Cost of goods sold
Gross profit
Operating expenses
Operating income
Net profit
Looking at each category individually helps you understand not only whether your business generated a profit, but also where that profit came from and where money is being spent.
Understanding the Main Sections of Your P&L
The first step in reading a P&L is knowing what each section represents.
Revenue
Revenue is the income generated through your normal business activities before expenses are deducted.
Depending on the business, this may include product sales, service revenue, recurring contracts, consulting fees, or other sources of operating income.
Revenue is an important number, but it should never be viewed by itself. A business can generate impressive sales while struggling to produce meaningful profit.
Cost of Goods Sold
Cost of goods sold, or COGS, represents costs directly associated with producing the products or services you sell.
For a product-based business, this could include inventory and materials. For some service businesses, it may include direct labor or other costs directly connected to delivering the service.
Subtracting COGS from revenue gives you gross profit.
Gross Profit
Gross profit shows how much money remains after paying the direct costs associated with generating revenue.
For example, if your business generates $100,000 in revenue and has $40,000 in direct costs, your gross profit would be $60,000.
Monitoring gross profit over time can help you determine whether pricing and direct costs are moving in the right direction.
Operating Expenses
Operating expenses are the costs associated with running your business that are not directly tied to producing a specific product or service.
These may include:
Rent
Marketing
Insurance
Software
Administrative payroll
Professional services
Office expenses
Utilities
These expenses can significantly affect profitability, which makes them important to monitor regularly.
Net Profit
After accounting for expenses, the amount remaining is your net profit, often called the bottom line.
This number is important, but understanding why net profit increased or decreased is even more useful.
That requires looking deeper into the P&L.
Revenue Is Only Part of the Story
Business owners naturally pay attention to sales. Growing revenue feels like a clear sign that the company is succeeding.
But revenue growth does not automatically equal financial growth.
Imagine your revenue increased 20% compared with last year, but your operating expenses increased 35%. Your company may be selling more while becoming less profitable.
This is why your P&L should be reviewed as a complete financial picture.
Ask questions such as:
Is revenue increasing?
Are expenses increasing faster than revenue?
Which products or services contribute most to profit?
Have margins improved or declined?
Is additional revenue translating into additional profit?
These questions help turn financial reports into useful business information.
What Does Gross Profit Tell You?
Gross profit can provide insight into how efficiently your business generates revenue.
If gross profit begins declining even while revenue remains steady, something may have changed.
Material costs could have increased. Labor may have become more expensive. Your pricing may no longer reflect the cost of delivering your services.
Suppose you sell a service for $1,000 that previously cost $500 to deliver. If the cost rises to $700 while the price stays at $1,000, you are still generating revenue, but you are keeping considerably less from each sale.
Tracking gross profit and gross profit margin can help you identify these changes before they significantly affect the business.
How to Spot Expenses That Are Growing Too Quickly
Expenses naturally change as a business grows. Hiring employees, investing in software, increasing marketing, or moving into a larger space may all be reasonable investments.
The key is understanding whether those expenses are producing enough value.
Compare expense categories from one month, quarter, or year to another. If an expense increases substantially, determine why.
For example, if marketing spending doubled, did revenue increase as expected? If payroll increased, did the business gain enough capacity or revenue to justify the additional expense?
Regular expense analysis can also reveal subscriptions that are no longer needed, services that have increased in price, or recurring expenses that have gradually become larger than expected.
K.G. Tax & Accounting Solutions includes profit margin and expense analysis as part of its financial oversight services, reflecting how closely these numbers connect to better business planning.
Why Profit Margin Matters
Looking only at the dollar amount of profit can sometimes hide an important trend.
Suppose your business earned $100,000 in revenue and $20,000 in profit last year. Your net profit margin was 20%.
This year, revenue increased to $150,000, but profit only increased to $21,000. You technically earned more profit, but your margin dropped to 14%.
The company grew considerably in sales while becoming less efficient at turning those sales into profit.
Tracking margins alongside revenue and profit gives you a better understanding of financial performance.
Compare Your P&L Over Time
One P&L statement tells you what happened during one period. Comparing several reports can tell you where the business is going.
Rather than reviewing each month independently, compare your results month over month, quarter over quarter, and year over year.
Look for patterns.
Maybe sales consistently slow during certain months. Perhaps payroll expenses are steadily increasing. Maybe one service has become significantly more profitable than another.
These trends can help you prepare for seasonal changes, adjust spending, refine pricing, and create more accurate financial forecasts.
Red Flags to Watch for on Your Profit and Loss Statement
There is no single number that indicates whether every business is financially healthy. Industries, business models, and stages of growth vary considerably.
However, several patterns deserve further investigation:
Revenue is increasing while net profit is declining.
Operating expenses are consistently growing faster than sales.
Gross profit margins are shrinking.
Certain expense categories increase without a clear reason.
Profit varies dramatically from month to month.
The business is generating sales but consistently struggling with profitability.
A red flag does not necessarily mean something is seriously wrong. It means there is something worth understanding.
Finding these patterns early gives you more time to determine the cause and make adjustments.
Turn Your P&L Into Better Business Decisions
Your P&L should be more than a report you review at tax time.
It can help guide decisions about pricing, hiring, marketing, expenses, expansion, and long-term planning.
For example, consistent margin pressure could signal that pricing needs to be reviewed. Rapidly increasing overhead could indicate a need for better cost management. Strong profitability may create an opportunity to reinvest in growth.
The important step is connecting what happened financially with what you plan to do next.
How a Fractional CFO Helps You Go Beyond the Numbers
As a business becomes more complex, interpreting financial reports and translating them into strategy can become more difficult.
That is where Fractional CFO services can provide additional support.
K.G. Tax & Accounting Solutions' Fractional CFO services include monthly financial reporting and KPI dashboards, cash flow management, budgeting and forecasting, profit strategy, pricing analysis, and other forms of strategic financial oversight.
Rather than simply knowing what your P&L says, you can use that information to determine what actions make sense for your business.
Understand the Numbers Behind Your Business
Learning how to read a profit and loss statement gives you greater visibility into how your company is actually performing.
Revenue tells you how much business you are generating. Gross profit helps you evaluate the economics behind those sales. Expenses show where your money is going. Profit margins help you understand whether growth is becoming more or less efficient.
Together, those numbers can help you make smarter decisions about the future.
K.G. Tax & Accounting Solutions helps small business owners turn financial reports into useful insights through financial reporting, profit analysis, forecasting, cash flow management, and Fractional CFO guidance.
If you are ready to better understand your numbers and use them to guide your next business decision, contact K.G. Tax & Accounting Solutions to learn more about Fractional CFO and financial planning services.

Reliable Tax & Financial Solutions for a Secure Future, Start Today!
We are committed to providing trusted, expert-driven tax and financial solutions designed to secure your financial future.
Client reviews
How We’ve Helped Our Clients
Absolutely phenomenal service! I came to Keesha with a daunting $23,000 tax liability, and through her expertise, attention to detail, and strategic approach, she reduced it to zero. I was blown away by her professionalism, clear communication, and commitment to getting the best possible outcome for me. Keesha explained everything in a way I could understand, found deductions and credits I never knew I qualified for, and handled the process with confidence and integrity. If you want results, honesty, and true tax expertise, this is the firm you need. Highly recommend to anyone serious about saving money! I recommend anyone/everyone in business to get the tax planning assessment!!!!

Mrs. Keesha is the tax GOAT! She is very professional and went above and beyond for my husband and I. I promise you, you can not go wrong using K.G. Tax & Accounting Solutions for all your tax and business needs.

I’m so happy to have found you online by searching for a tax preparation and professional lady. You helped me in more ways than one. I give you five stars.

K.G did my taxes this year and I was fully satisfied! She was able to get my taxes done within a week. I reached out to her thinking I would need to file an extension but she told me that we would meet the deadline and we did! Very professional, efficient and pleasant. I would recommend.

Mrs. Ezell has been doing my taxes for several years. She is professional, knowledgeable, prompt and affordable. I am very satisfied with her service.

For those seeking reliable tax services or an accountant, K.G Tax & Accounting Solutions is highly recommended. They keep abreast of tax laws, ensuring that detailed information is always available. The customer service and the depth of knowledge they provided to my husband and me were especially noteworthy. Having a dependable partner is crucial for financial management. As a small business owner, it's important to have someone who grasps the financial dos and don'ts for your business and can assist in optimizing all aspects for financial success. Their professionalism and tax expertise are outstanding! Mr. & Mrs. Carter

Transparency Review- my taxes was a “MESS” not a little one either a “BIG MESS” I absolutely love Keesha she saves my life every year and helps me move my business in a positive direction 🥰. Goes above and beyond all year round not just tax time. Very down to earth and knowledgeable.…

Reliable. Transparent and Personable. Well use again!




Join Our Mailing List
Subscribe for timely tax reminders, money tips, and exclusive discounts on our digital tools.
frequently asked questions
Find Quick Answers
Do you file federal and state tax returns?
Yes! We prepare federal and state returns. Multi-state filings are supported; fees apply for state-specific filings.
Are you licensed/insured?
Our staff includes experienced accounting professionals and we carry professional liability coverage.
How do I upload my documents?
Use our secure app or Google Form. You’ll receive a secure link after booking.
What payment methods do you accept?
We accept major credit cards, ACH transfers, and business checks.
What if I need ongoing support?
Choose from our Essential, Growth, or Elite packages, or request a custom engagement.
Read Our Blog


Quick Links
Resources
Legal
Connect With Us
Follow Us


© Copyright 2026. K.G. Tax & Accounting Solutions - All Rights Reserved